Hurricane diagram game quiz online
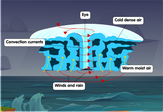 If you live near the Equator, you might be awfully familiar with the huge, hulking, violent storms we know as tropical cyclones. Depending on where they form, tropical cyclones can also be named as typhoons or cyclones. When they appear over the Atlantic Ocean or the eastern half of the Pacific Ocean, these storms are called hurricanes. Hurricanes can form as warm, moist air over the ocean rises to the sky, leaving less air near the surface. As the air rises, they cool down and condense into clouds. Air from the surrounding areas flows into the area of low pressure left behind. This air also becomes warm and rises up, repeating the cycle until there are lots of heaping clouds above. The primary parts of a hurricane are the eye, the eyewall, and the spiralling rainbands. The eye is an area of relatively calm weather at the center of the hurricane. In contrast, the eyewall that surrounds it is usually where the rains and winds are the most dangerous. Rainbands are dense clusters of clouds that spiral away from the eye. You can use this detailed
hurricane diagram
as a handy and convenient reference for learning more about the weather patterns that affect millions of people each year.
If you live near the Equator, you might be awfully familiar with the huge, hulking, violent storms we know as tropical cyclones. Depending on where they form, tropical cyclones can also be named as typhoons or cyclones. When they appear over the Atlantic Ocean or the eastern half of the Pacific Ocean, these storms are called hurricanes. Hurricanes can form as warm, moist air over the ocean rises to the sky, leaving less air near the surface. As the air rises, they cool down and condense into clouds. Air from the surrounding areas flows into the area of low pressure left behind. This air also becomes warm and rises up, repeating the cycle until there are lots of heaping clouds above. The primary parts of a hurricane are the eye, the eyewall, and the spiralling rainbands. The eye is an area of relatively calm weather at the center of the hurricane. In contrast, the eyewall that surrounds it is usually where the rains and winds are the most dangerous. Rainbands are dense clusters of clouds that spiral away from the eye. You can use this detailed
hurricane diagram
as a handy and convenient reference for learning more about the weather patterns that affect millions of people each year.
A hurricane diagram
A hurricane diagram is a graphical representation of the wind and pressure patterns within a tropical cyclone, such as a hurricane or typhoon. It is used by meteorologists to understand the structure and intensity of the storm and to make forecasts about its future behavior.
The main components of a hurricane diagram are:
-
The wind barb: This is a small line segment with small flags attached to it that indicates the wind speed and direction at a particular location. The length of the line segment represents the wind speed, and the orientation of the flags indicates the wind direction. For example, a wind barb with a long line segment and flags pointing to the right would indicate a strong wind from the east.
-
The pressure contours: These are lines that connect points of equal pressure within the storm. The pressure is typically plotted in millibars (mb), and the contours are typically drawn at intervals of 4 mb. The central pressure of the storm is indicated by a circle or dot on the diagram.
-
The wind and pressure data: The wind data are plotted using wind barbs, and the pressure data are plotted using contours. The data are usually plotted at specific levels in the atmosphere, such as the surface, 850 mb, 700 mb, and 500 mb.
-
The legend: This provides information about the units of measurement used on the diagram and may also include additional information about the storm, such as its name and location. The legend may also include a scale bar that shows the wind speeds and pressure values associated with the wind barbs and pressure contours.
To interpret a hurricane diagram, you can look at the wind barbs and pressure contours to understand the wind and pressure patterns within the storm. The wind barbs show the wind speed and direction, while the pressure contours show the distribution of pressure within the storm. The central pressure of the storm is indicated by a circle or dot on the diagram, and the legend provides information about the units of measurement and other details about the storm.