Faulting diagram game quiz online
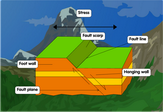 A fault is a crack or fracture that forms from the stress of two moving blocks of land in the Earth’s crust. These fractures allow such blocks to move. The largest faults include the edges of the tectonic plates themselves, although other faults are much smaller. Faults are significant in geology as earthquakes; as blocks of land move a lot in areas with faults, rocks can break and release energy which causes the ground to shake. The main parts of a faulting diagram include a hanging wall or headwall, a footwall, a fault line and a fault plane. The hanging wall starts out as the upper block along a fault. The lower block is called a footwall. A fault line represents the fault itself. As the blocks of land move, they expose a new surface called a fault plane. Faults can be categorized depending on its angle and the direction to which it slips along the fault. In normal dip-slip faults, the hanging wall slides down while the footwall is raised upward. The reverse happens in thrust faults. On the other hand, a strike-slip fault has both blocks of land sliding past one another, moving much like how you’d rub both your palms together. You can examine this
faulting diagram
to help you learn more about the basic concepts in geology and better comprehend how earthquakes occur.
A fault is a crack or fracture that forms from the stress of two moving blocks of land in the Earth’s crust. These fractures allow such blocks to move. The largest faults include the edges of the tectonic plates themselves, although other faults are much smaller. Faults are significant in geology as earthquakes; as blocks of land move a lot in areas with faults, rocks can break and release energy which causes the ground to shake. The main parts of a faulting diagram include a hanging wall or headwall, a footwall, a fault line and a fault plane. The hanging wall starts out as the upper block along a fault. The lower block is called a footwall. A fault line represents the fault itself. As the blocks of land move, they expose a new surface called a fault plane. Faults can be categorized depending on its angle and the direction to which it slips along the fault. In normal dip-slip faults, the hanging wall slides down while the footwall is raised upward. The reverse happens in thrust faults. On the other hand, a strike-slip fault has both blocks of land sliding past one another, moving much like how you’d rub both your palms together. You can examine this
faulting diagram
to help you learn more about the basic concepts in geology and better comprehend how earthquakes occur.
Fault diagrams
In geology, a fault is a planar fracture or discontinuity in a volume of rock, across which there has been significant displacement as a result of rock-mass movement. Faults are a fundamental component of many rock formations, and are the result of tectonic forces that have shaped the Earth's crust over billions of years.
A faulting diagram is a graphical representation of a fault and its associated features, such as the relative displacement of the fault planes and the orientation of the fault planes relative to the Earth's surface. A faulting diagram can be used to visualize the geometries and relationships of different types of faults, and to understand how these faults have evolved over time.
There are several types of faulting diagrams that can be used to represent different aspects of faulting, including:
-
Cross-sectional diagrams: These diagrams show a cross-section of the Earth's crust, with the fault represented as a line or zone of displacement. The relative displacement of the fault planes is shown by the size and direction of the arrows.
-
Block diagrams: These diagrams show the relative displacement of blocks of rock on either side of a fault. The blocks are represented as rectangles, and the displacement is shown by the distance between the blocks.
-
Three-dimensional diagrams: These diagrams show the orientation of the fault planes in three dimensions, and may include a cross-sectional view or a block diagram to show the relative displacement of the fault planes.
-
Temporal diagrams: These diagrams show the evolution of a fault over time, including the direction and magnitude of displacement at different stages in the fault's history.
Overall, faulting diagrams are useful tools for visualizing and understanding the geometries and relationships of different types of faults, and for analyzing the processes that have shaped the Earth's crust.